A photometric report can sometimes seem intimidating, but it's primarily a tool designed to facilitate your lighting choices. Understanding this document will allow you to optimize your installations, better comply with lighting standards, and convince your clients of the relevance of your LED solutions. In this article, we will review the main elements that make up a photometric report and how to interpret them effectively.
Key elements of a report photometric analysis
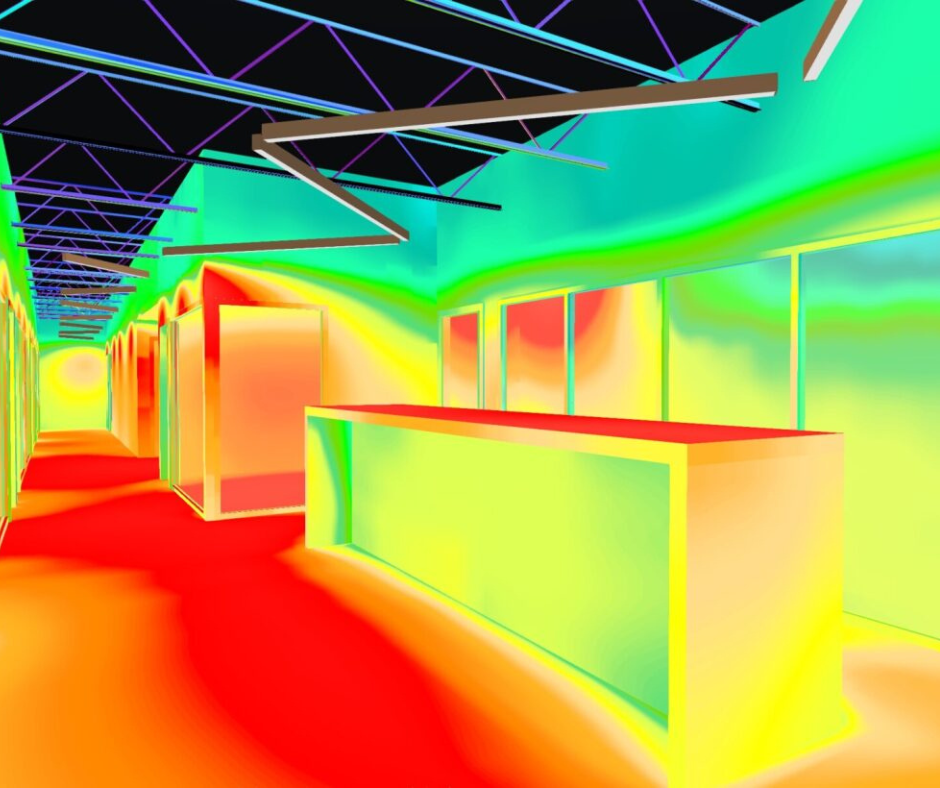
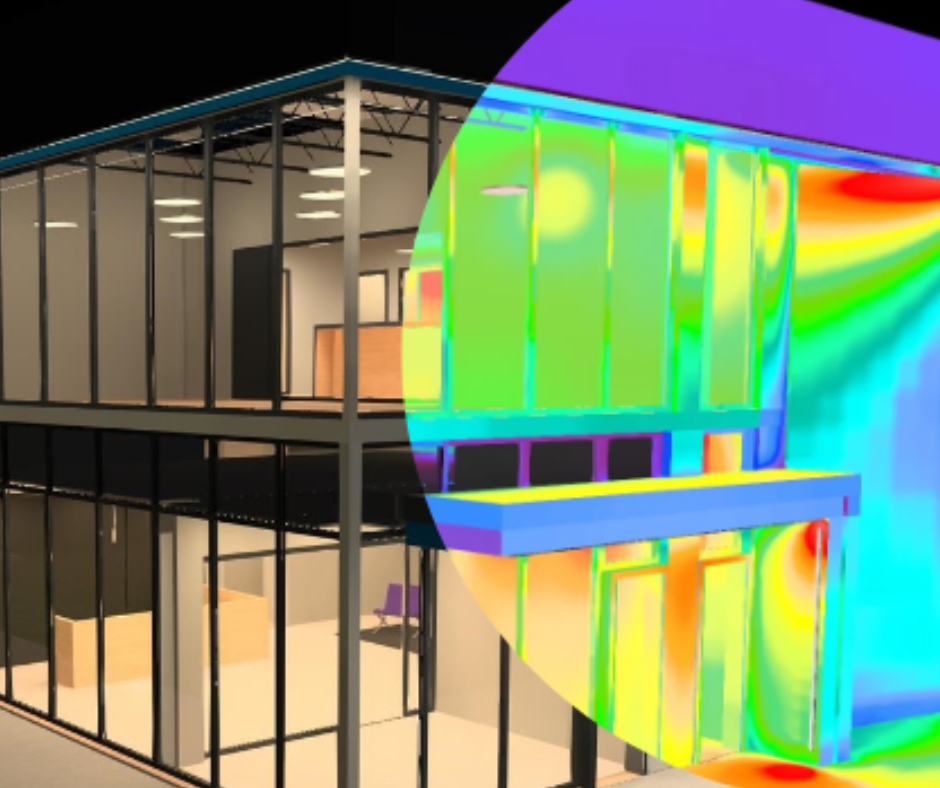
1.Isolux curves ( or false colors)
False colors orisolux curves show the distribution of illumination (expressed in lux) on a given surface (floor, work surface, wall, etc.).
-
Practical reading : Observe whether the most frequented areas (workstations, passageways) reach the recommended lux levels ( For example, between 300 and 500 lux in offices, or 750 lux for a mechanic's garage)
-
Optimization : If certain areas are underlit or overlit, consider repositioning the luminaires or choosing an appropriate wattage.

2. The total luminous flux (in lumens )
Indicated in lumens, the total luminous flux measures the quantity of light emitted by the luminaire.
-
Comparison : Adjust this value to the actual needs of your project. For example, a warehouse will require a much higher flow rate than a meeting room or a small business.
-
LED Choice : LED luminaires are often distinguished by a high luminous flux combined with low consumption.

3. Luminous efficacy (in lumens per watt )
Luminous efficacy quantifies the energy performance of a luminaire.
-
Example : A 120 lm/W luminaire is more economical to use than an 80 lm/W model.
-
LED Advantage : LED solutions offer some of the best luminous efficiencies on the market today, enabling substantial energy savings.

4. Color temperature (CCT)
Expressed in Kelvin (K), color temperature directly influences the ambiance and functionality of a space.
-
Warm light (2700K-3000K) : Intimate and friendly atmosphere, ideal for restaurants, hotels or residential living rooms.
-
Cool light (4000K-5000K) : Promotes concentration and visibility, perfect for offices, workshops or industrial environments.
For better uniformity and visual rendering, it is preferable to maintain the same color temperatures in adjacent spaces, or for example in all exterior lighting of the building.

5. Light fixture location plan
Our analysis always includes a plan showing the exact location of each proposed luminaire . This plan is essential for the implementation of your lighting project. It allows you to precisely visualize the layout of the equipment, ensure installation complies with specifications and guarantee that the light distribution meets the objectives established in the isolux curves.

Steps to analyze a photometric report
-
Define your goals:
-
What is the main purpose of lighting: functional, aesthetic, or both?
-
What lux levels are required by your space or professional standards? You can rely on the standards indicated in the report.
-
Examine the luminous flux and efficacy. Check whether the quantity of light (in lumens) and the efficiency (lm/W) match your expectations and energy constraints.
-
-
Analyze false colors and location plan:
-
Identify any areas of shadow or overexposure on the isolux curves.
-
Consider following the orientation, power, and layout of the luminaires suggested in the report, which represents the optimal lighting solution proposed by our experts.
-
-
Evaluate the light characteristics:
-
Color Temperature (CCT) : Consider the desired ambiance for each space.
-
Lighting uniformity : Essential for visual comfort. Refer to the results And as well as the recommended standards, which you will find in the "Calculation Objects" section of the report.
-
-
Compare multiple options (if applicable):
-
If you are hesitating between several lighting fixtures or scenarios, put their specificities into perspective to make an informed choice aligned with your objectives.
-
Remember to include long-term energy costs in your assessment.
-
Expert advice: For all these elements, consult our lighting specialists. They are trained to offer you the best solutions, both financially and visually, while scrupulously respecting the recommended standards for rendering and uniformity.
Why it is essential to know how to read a photometric report
-
Optimize your choices : A well-interpreted photometric report prevents you from investing in inadequate luminaires, thus reducing costs and potential returns.
-
Meet standards : Ensure you meet regulatory and industry requirements, a guarantee of credibility and professionalism.
-
Convince your clients : As a professional, a well-explained photometric report builds trust and demonstrates the relevance of your proposals, particularly during projects where precision and performance are essential.
Ultimately, a photometric report isn't just a technical document: it's the compass that guides you toward optimal, energy-efficient lighting. If you need help interpreting photometric data or selecting the ideal LED luminaire, our team is here to help. We offer a free analysis service and are here to support you every step of the way in your lighting project, from design to implementation.
Do you have a lighting project in mind?
Contact us now to benefit from our expertise in photometry, ROI analysis, and cutting-edge LED solutions. We'll help you realize your vision of a bright, functional, and cost-effective space.